There has been a great deal of press on Aswath Damodaran’s paper ”Value Investing: Investing for Grown Ups?” in which Damodaran asked, “If value investing works, why do value investors underperform?
This 77 page report offers plenty of grist for the mill, but one study really stood out because it highlights the problem with the first order thinking that most investors, including some of the highest profile managers, use in their security selection process.
It is a commonly held belief that so-called 'blue chip' or 'high quality' stocks will outperform over the long-term. High quality is often defined as a function of balance sheet strength, earnings consistency, capital efficiency and margins, with companies who rank highly in these areas generally favored over companies who rate lowly. This obviously makes intuitive sense.
Interestingly however, and as so often happens in markets, the obvious and intuitive assumption turns out to be dead wrong. The following table, taken from Damodaran's paper, shows the average financial characteristics of two portfolios formed from screens of high quality stocks or 'Excellent Companies' versus low quality or 'Unexcellent Companies'. Clearly the financial characteristics of the Excellent Companies portfolio would appear substantially more attractive and, in theory, would warrant higher returns.
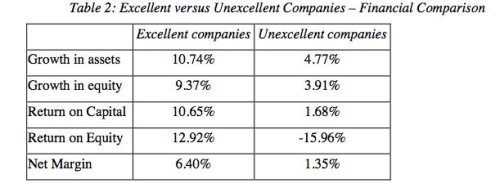
Source: Clayman, Damodaran, 2012
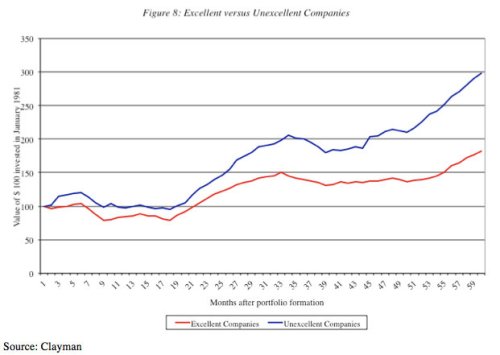
This wouldn't be a very interesting post if the results worked out as expected, and in fact they don't. You can see from the chart below that the un-excellent companies substantially outperformed the excellent companies over the investigated period.
So what happened? You mean we can't count on strong investment performance from the companies with superior financial characteristics?
This is a good example of first order thinking. According to the report, most people examine company fundamentals and, if they are strong, assume that an investment in that company will work out well over time. Unfortunately, if everyone else is looking for companies using similar criteria, then those companies will experience a larger demand for shares. The larger demand will have already pushed the price of these stocks higher to reflect the strong fundamentals, and investors who pay higher prices for a value stock will necessarily receive lower returns over the long term.
In contrast, 'un-excellent' companies are in very low demand, which means their stocks will be relatively cheaper. In fact, the price of low quality value stocks is cheaper than would otherwise be warranted by fundamentals, because people assume that these low quality stocks will generate lower returns. As a result of their unexpectedly low prices, a diversified portfolio of these companies actually ends up delivering better long-term returns.
What can we say? No one said it was easy to make money in markets. If it were, then typical investors would be beating the market rather than lagging the markets by 3 to 5% per year, per the chart below. One of the reasons behind this disparity is that it is difficult to act against your intuition, and your intuition is often wrong because of myriad emotional and cognitive biases.
In other words, our wetware isn't equipped to make profitable choices in complex domains like the markets.

Source: Dalbar, 2012
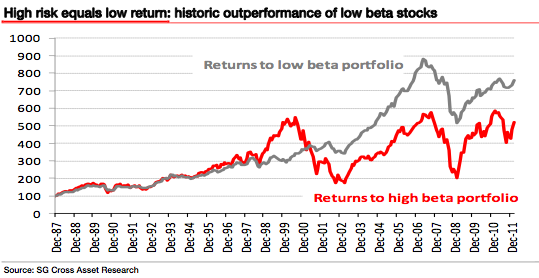
Another important example of the fallibility of our wetware relates to the common myth that you must take higher risk to achieve higher returns. The following chart compares the returns of two portfolios: the red line reflects the performance of a portfolio formed from the most volatile U.S. stocks each quarter back to 1987, while the grey line shows the performance of the least volatile stocks.
Against all intuition, lower risk stocks outperform higher risk stocks, and by a substantial margin. Lower risk = higher return? Who'd a thunk?
While it's interesting to learn that lower risk equals higher returns in stocks, you may also be surprised to learn that stocks deliver their best performance during periods of low stock market volatility, and deliver their worst results during periods of high volatility. The chart below shines a spotlight on this effect.

Source: Yahoo Finance, DarwinFunds.ca
The chart highlights that the compound returns from stocks during periods of highest volatility delivered negative returns, while the returns during periods of lowest volatility delivered spectacular returns.
This is highly relevant because, while it is more difficult to forecast returns, it is much easier to forecast volatility. The following chart shows the near linear correlation between a monthly forecast based on a weighted average of recent monthly market volatility, and the actual market volatility realized over the subsequent month.

Source: Falkenblog
Given that we can effectively forecast volatility, and periods of high volatility generally correlate with periods of lower returns, imagine what we can achieve by lowering exposure when forecast volatility is above a certain threshold, and increasing exposure when forecast volatility is below the threshold.
To see how we integrate this technique and other concepts into our portfolio management approach, please visit us online at DarwinFunds.ca.